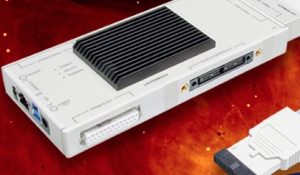
TRACE32 debugger
Developers using the 64-bit OS with Lauterbach’s TRACE32 debugger can use the new debugging capabilities with the latest software update.
This includes operation on both ARM and Intel architectures, both in 32-bit and 64-bit processor technology.
This means it targets 64-bit architectures such as ARMv8 and Intel Core technologies.
Applications can now use the full 64-bit address range, and the debugger will automatically handle the extended addressing.

Barry Lock at the UK Device Developer’s Conference
Barry Lock, UK Manager at Lauterbach, writes:
“While QNX were bringing the new QNX 7.0 version to release status, we have been busy extending and testing our TRACE32 debugger to provide full QNX 7.0 OS aware debugging capabilities.”
Being a JTAG debugger, it is able to halt and debug the whole system, without the need of a target side debug agent. This allows the user to debug startup code, interrupts, drivers and other low level code.
TRACE32 will also interpret the MMU tables of the OS, so that the debugger can access the complete physical memory, and also knows the address translations and virtual addresses of all processes and applications.
 Electronics Weekly Electronics Design & Components Tech News


